
The Fort Knox Model is named after the United States Bullion Depository, often known as Fort Knox. Both are rock solid, and have a lot to do with money. The depository is a fortified vault building adjacent to the Fort Knox Army Post. It is operated by the United States Department of the Treasury and stores over half the country's gold reserves.

Summary of what the Fort Knox Model does
The Fort Knox Model is an integrated financial statement forecasting model. This means that it forecasts a complete Balance Sheet and Cash Flow statement for future time periods, in addition to the Income Statement.
In this article we provide an overview of the model. Subequent articles will cover the basics for loading history and getting it ready to use.
The Fort Knox model has a modest number of line items – about 80 for the P&L and 60 for the balance sheet, plus additional margin, cash flow, and KPI line items.
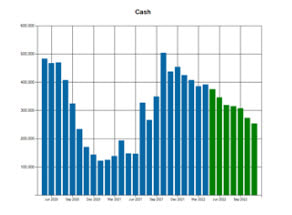
Essentially you load up historical data exported from your accounting system, input assumptions about key drivers of profits and cash flow, and look at the resulting projection of Net Income and Cash for the next 6 to 18 months, or beyond.
There is room in the model for up to 6 years of history, by month. Besides the current year, there is room for an additional 36 months of forecast, and 10 years after that. You can elect to forecast the 36 months broken down into months, or to switch to annual forecasts after the current year. The model does a number of calculations on the historical numbers to help you forecast the future and evaluate the reasonableness of your forecast.
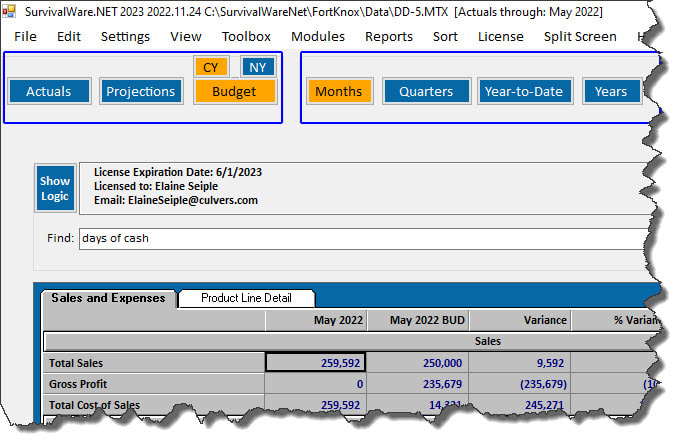
A separate set of columns is set aside to house the current year budget and next year budget. You probably will want to update the forecast every month. However, the budget stays static throughout the year, and is used for goal setting and performance monitoring.
The Matrix File
matrix file is similar to a spreadsheet. It consists of rows and columns of cells, but it is not free-form. The rows correspond to line items in the financial model – things like “Sales”, “Rent”, “Net Income”. The columns represent time periods.
In the Fort Knox model, there are several years worth of months as columns, and then also the quarters, year to date totals, and year totals derived from the months. The model is smart enough to know the difference between a P&L row, and a Balance Sheet row. It knows to sum up the 12 months of a year to get “Total Sales” for the year, but that “Total Assets” is an ending balance, and the year value should be the same as the last month of that year.
What the model is used for
Some examples
Major Sections of the Fort Knox Model
ROWS
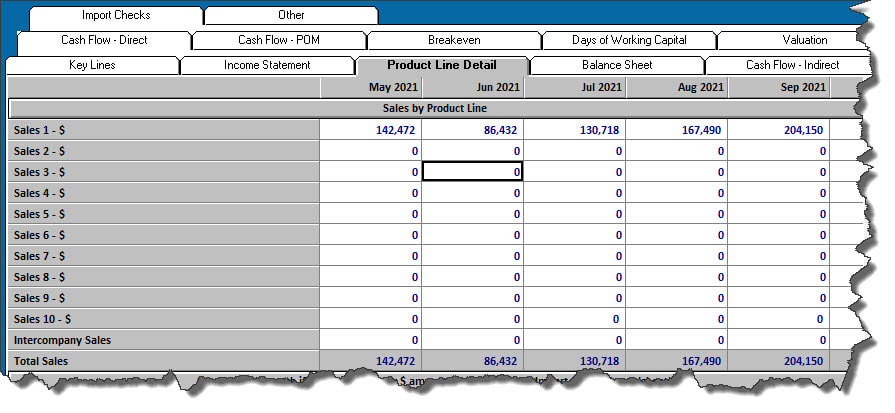
Sales – up to 10 separate categories, plus a row for Intercompany Sales
matrix file is similar to a spreadsheet. It consists of rows and columns of cells, but it is not free-form. The rows correspond to line items in the financial model – things like “Sales”, “Rent”, “Net Income”. The columns represent time periods.
In the Fort Knox model, there are several years worth of months as columns, and then also the quarters, year to date totals, and year totals derived from the months. The model is smart enough to know the difference between a P&L row, and a Balance Sheet row. It knows to sum up the 12 months of a year to get “Total Sales” for the year, but that “Total Assets” is an ending balance, and the year value should be the same as the last month of that year.
What the model is used for
- Cash flow forecasting for SMB
- Financial reporting
- Financial analysis
- Budget preparation
- Loan proposals
- Raising capital
- Cloning
Some examples
- Environmental consulting firm consolidates two divisions and forecasts profits and cash throughout the year
- Window distributor keeps an eagle eye on projected cash
- Equipment parts distributor finds it easier to do financial reporting for its three divisions using the Fort Knox model rather than their accounting software
- An e-commerce company needed a custom built financial model to navigate some rough waters. They were able to get it done cheaply by starting with the Fort Knox model.
Major Sections of the Fort Knox Model
ROWS
Sales – up to 10 separate categories, plus a row for Intercompany Sales
Cost of Sales – up to 10 separate categories, matched to the sales rows
Gross Profit and Gross Margin % by category
Gross Profit and Gross Margin % by category
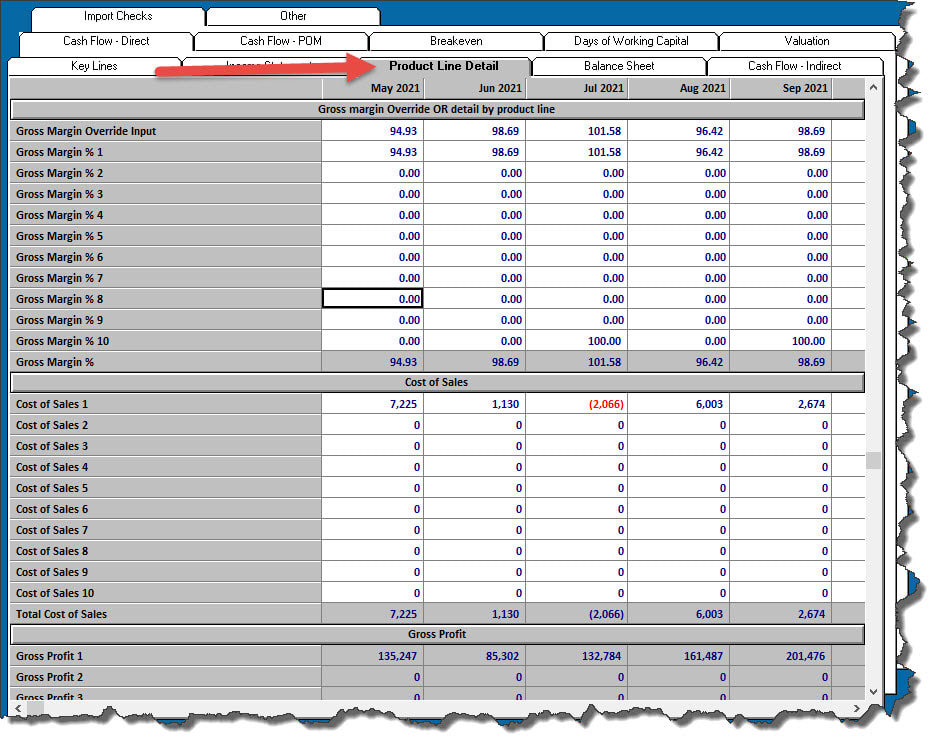
Note: Instead of detailed product lines, you have the option of doing a summarized sales forecast where you input Unit Volume and Price per Unit to drive the overall dollar forecast.
Operating Expenses, including 5 “Other Operating Expense” lines that you can rename
Interest and Other Expenses - up to 10 categories of loans, credit lines, and notes payable
Income Taxes and Net Income - the usual suspects
Assets
Current Assets - the standard one plus 3 “other current asset” categories that can be renamed
Long Term Assets - fixed assets, intercompany receivables, other assets
Liabilities
Current Liabilities - accounts payable, credit card balances, current maturities, credit line tied to A/R balance, other credit line, other payables, deferred revenue
Long Term Liabilities - deferred taxes, long term debt, intercompany payables, other long-term liabilities
Equity
- opening balance, common stock, additional paid in capital, owner distribution / dividends, retained earnings
3 kinds of Cash Flow:
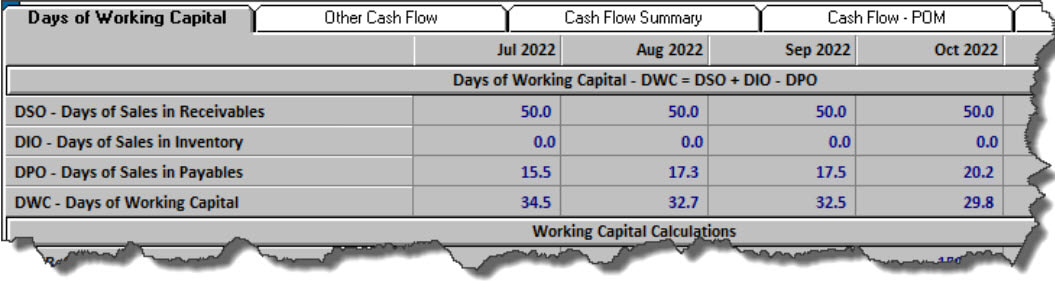
Working Capital and Days of Working Capital
Break Even Analysis
Valuation
Columns
The Fort Knox model consists of a total of 448 columns.
Months
Year to Date
Rolling Averages
Quarters
Years
Up to 10 additional years of projections, input as full year values
Note: the column logic for summing months into quarters, years, year to date values, and rolling averages occurs in the middle of the model.
P&L items (summed) are treated differently from balance sheet items (end of period balance) when populating the aggregate columns. Calculations of ratios and percentages are done after the column summing has taken place.
Operating Expenses, including 5 “Other Operating Expense” lines that you can rename
Interest and Other Expenses - up to 10 categories of loans, credit lines, and notes payable
Income Taxes and Net Income - the usual suspects
Assets
Current Assets - the standard one plus 3 “other current asset” categories that can be renamed
Long Term Assets - fixed assets, intercompany receivables, other assets
Liabilities
Current Liabilities - accounts payable, credit card balances, current maturities, credit line tied to A/R balance, other credit line, other payables, deferred revenue
Long Term Liabilities - deferred taxes, long term debt, intercompany payables, other long-term liabilities
Equity
- opening balance, common stock, additional paid in capital, owner distribution / dividends, retained earnings
3 kinds of Cash Flow:
- Direct
- Indirect
- POM (Peace of Mind Schedule from Philip Campbell’s first book, “Never Run out of Cash”)
Working Capital and Days of Working Capital
Break Even Analysis
Valuation
Columns
The Fort Knox model consists of a total of 448 columns.
Months
- History (60 months prior to the current year, plus one month for beginning balances)
- Current Year (12 months)
- Projected (up to 36 months)
- Current Year Budget (12 months)
- Next Year Budget (12 months)
Year to Date
- History (60 months prior to the current year)
- Current Year (12 months)
- Projected (up to 36 months)
- Current Year Budget (12 months)
- Next Year Budget (12 months)
Rolling Averages
- History (60 months prior to the current year)
- Current Year (12 months)
- Projected (up to 36 months)
Quarters
- History (20 quarters prior to the current year)
- Current Year (4 quarters)
- Projected (up to 12 quarters)
- Current Year Budget (4 quarters)
- Next Year Budget (4 quarters)
Years
- History (5 years prior to the current year)
- Current Year (1 year)
- Projected (up to 3 years)
- Current Year Budget (1 year)
- Next Year Budget (1 year)
Up to 10 additional years of projections, input as full year values
Note: the column logic for summing months into quarters, years, year to date values, and rolling averages occurs in the middle of the model.
P&L items (summed) are treated differently from balance sheet items (end of period balance) when populating the aggregate columns. Calculations of ratios and percentages are done after the column summing has taken place.

 RSS Feed