SurvivalWare Cash Flow Software
  • Home
  • Products
  • FAQ
  • Blog
  • About
  • Contact

Calculating the ROI from implementing a financial reporting system

1/9/2023

0 Comments


A few days ago, I received an email from a competitor making the case for implementing a financial reporting system.  It starts: 

 "Studies have shown that finance organizations typically spend almost half of their time just creating and updating reports.  Rather than providing strategic insights to the organization, the FP&A team is wasting valuable time on menial work."


OK.
But, hhenever a sentence starts with “Studies have shown”, it probably should say “I’m sure there is a study somewhere that will back me up!”


And “typically spend almost half their time..” means “we don’t really know, but they do spend a lot of time..”

Nevertheless, I think we can agree that in today’s finance departments there is a lot of menial work that goes into the preparation of financial reports, most of it tied to spreadsheets.  At least it is impossible to introduce errors into a spreadsheet report.   Oh wait - I got that wrong.  It is impossible NOT to introduce errors into a spreadsheet report.  That is, if you can find the right version of the spreadsheet to mess up.  I’m sure there are studies somewhere to back me up.

The email goes on:

    "This time would be better spent equipping and empowering all business functions with the information they need to make better decisions. By automating standard reports and giving everyone the tools to generate reports autonomously, Finance gains more freedom to enable both short-term strategic decisions and long-term success."

100%!  So let’s talk about ROI and what is possible by implementing an automated financial reporting system.

ROI

We’ll leave aside the issue of what software to use to build this magical automated financial reporting system, and consider the costs and benefits in a general sense.  
​
(There is an excellent article on the Issuetrak website that explains the concept of ROI.  They even provide a calculator that lets you plug in your own assumptions about a particular project.  It is a downloadable Excel spreadsheet.  I’m sure there is no chance of error in using it!)

Why are you doing this in the first place?  What do you hope to accomplish?  What is the payoff?

Here are the key benefits of implementing an automated financial reporting system:
  • Time savings in report and budget preparation
  • Improved accuracy
  • Better decision making

The first one is the most quantifiable, while the last two are the real payoff.

Time Savings

You might be able to estimate the time savings for the finance staff, and multiply that by an hourly cost.  OK - you probably won’t reduce staff and realize a direct cost savings in the short term.   But you will be better able to handle growth without needing additional staff.  Also, the time freed up can be spent thinking and analyzing, or doing other things of value.

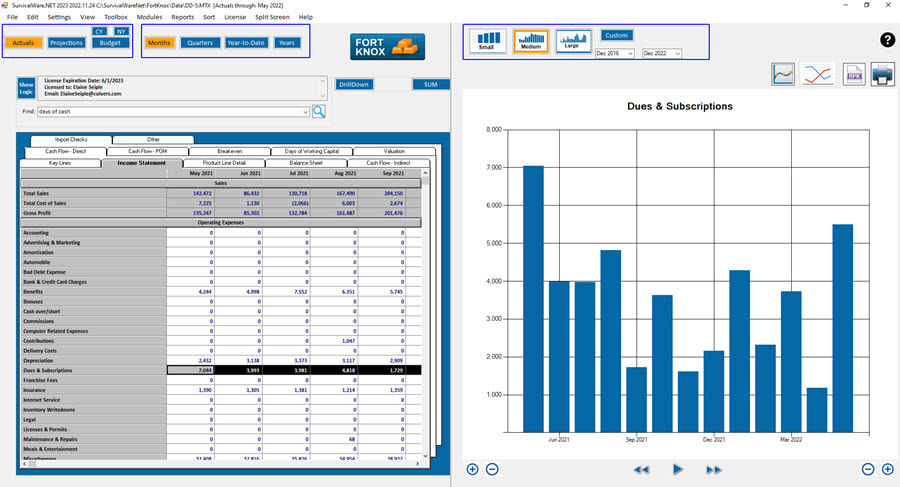
I don’t have a study to back me up, but I do have some anecdotal evidence.  Over the past few years I implemented a nifty financial analysis and reporting system for Issuetrak while serving as CFO.  (I’ll describe the system in detail in a future blog post). 

It pulls in financial data from Issuetrak’s accounting system.  It also uses customer and sales funnel data from the CRM, salaries from the payroll system, and marketing metrics from various sources.  At its core is a financial model that looks into the future, and helps keep us on track.  The system is a wealth of information, and serves as the backbone for presentations at Board meetings, the monthly confidence package, KPI reports, and special analyses.

As a result of the high degree of automation, I have been able to cut back to part time.  Issuetrak saves some big bucks.  I get to live the dream.  Not a bad outcome!

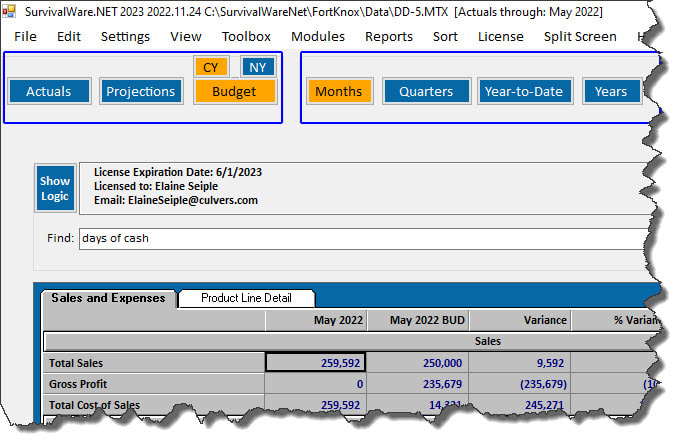
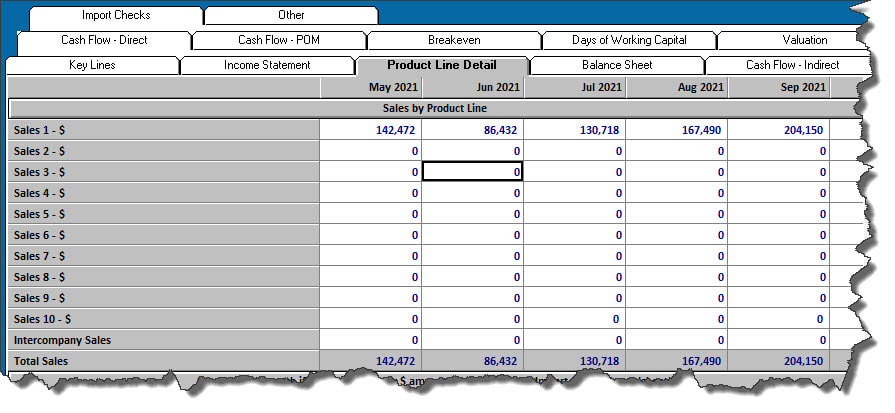
Then there is my friend, author and consultant, Philip Campbell.  Philip has used SurvivaWare to automate the financial reporting systems of many companies (from the very small to the very large).  He actually prepares a monthly confidence package or set of operating reports directly from SurvivalWare every month.  The automated financial reporting frees him up to spend time at what he is good at - analyzing what is going on with cash and profits, and communicating his insights to decision makers.  And playing golf?

Philip says SurvivalWare is a must for any company he is working with because it automates the financial analysis, forecasting, and reporting process for him. It helps keep the data organized and all in one place.  It allows him to quickly and easily stay on top of financial performance and cash flow. Spreadsheet version control is a thing of the past.

Philip does a great job of explaining financial forecast and cash flow in this real world example:
 
https://financialrhythm.com/understanding-cash-flow-real-world-example/

Improved Accuracy

Improved accuracy really is a thing.  I’d hate to have to quantify its value - but it is there.  Think FTX if you are looking for an example of bad things happening with bad financial data.  

“Never in my career have I seen such a complete failure of corporate controls and such a complete absence of trustworthy financial information as occurred here [FTX]”
  • John Ray, III - new CEO of FTX

You don’t want to be like FTX.

Accuracy is like your health - one of those things you notice only when it is gone.  Automated financial reporting systems are not perfect.  But compared to spreadsheets?  Let’s just say the bar is low.

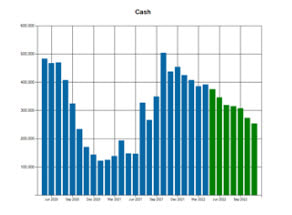
The other thing about an automated financial analysis and reporting system is that it improves your sense of smell.  Of course, I mean your ability to apply the “smell test” to all sorts of data used to make decisions.  Seeing monthly numbers side by side, especially in graphs, puts the spotlight on anomalies and candidates for more inquiry.  Why did hosting costs double from one month to the next?  Was that an accounting error, maybe timing?  

You can compare sales totals from the CRM with the accounting system.  They had better match, or someone has some splainin’ to do.

Decision Making


Is the Customer Acquisition Cost significantly higher than the lifetime value of the customer?  Maybe it’s time to rethink our marketing strategy.  

Other way around?  Time to put the pedal to the metal!

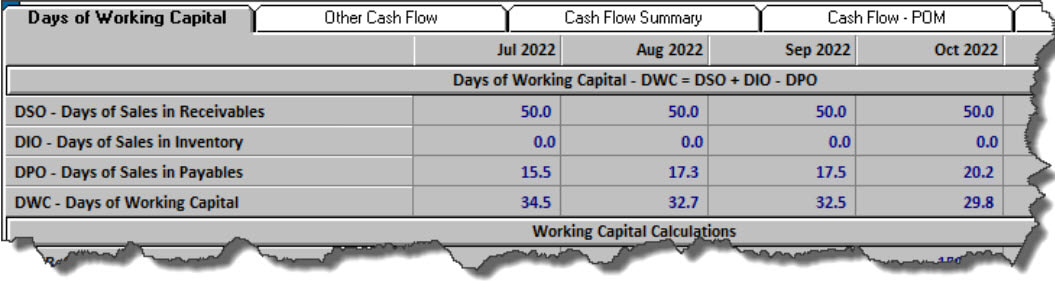
If we reduce our collection period by 15 days, that frees up $500,000 of cash.  Is it worth the effort?

What is the cash impact of ramping up the marketing budget if there is a 6 month lag in results?

Suppose sales dip 10% next year?  Are we in trouble?

How sensitive is our business to interest rates?

The list goes on..

Back to ROI

We need to calculate the investment and compare it to the return.  

The investment includes costs such as:
  • Software licensing and maintenance
  • Hosting fees
  • Implementation
  • Training
  • Ongoing maintenance
    • Response to external changes (e.g. a feeder system has a change in format)
    • New reports and analyses
    • Support and problem resolution

You should be able to estimate these costs fairly easily.  If you have engaged a software vendor or consultant, they will be able to get these numbers for you.

I’d suggest a 3 to 5 year time horizon, and penciling in costs for each year.  The total investment for ROI purposes is the Net Present Value of these costs.


Return

Do the same for the return:  pencil in the value of the time savings each year, and compute the Net Present Value.

To calculate the return:

  • Estimate the time savings as a percentage productivity gain for key financial workers.  Depending on how labor intensive your current process, you might come up with a number between 10% and 50%.
  • Multiple this percentage by the fully loaded salaries of the workers involved.  This gives you a number that should represent the minimum return you can expect to get.

For the soft benefits:
  • Think hard about the types of errors you hope to eliminate.  Have there been any whoppers in the recent past?  List them out.  Use words, not numbers.  I know - you probably don’t want to call attention to any past mistakes.  Think about them, anyway. Write them down.  Use invisible ink if you must.
  • Think hard about the types of decisions made based on the financials - both recent performance and near term outlook.  Is survival an issue?  Cash tight?  Are there major decisions to be made about hiring and expansion?  Remote vs hybrid office model?  Major technology upgrades?  An acquisition? The list goes on..


ROI is then:

(NPV Benefits minus NPV Costs) as a percentage of NPV Costs.

**NPV is Net Present Value.

Any software vendor worth its salt will be able to provide you with a spreadsheet showing huge benefits, modest costs, and a triple digit ROI.  No possibility of errors in that spreadsheet!

But this is something you need to think about yourself, in the context of your business.
If you are trying to raise capital or sell the business, the value of good financial information - and hence, the value of an automated financial reporting system - skyrockets.

Chances are, there is a huge payoff from automating your financial reporting system.  Just find a software vendor you can trust.   

Oh wait - is that an oxymoron?!


Contact Us for Free Consultation
0 Comments

Rollover for the New Year

1/2/2023

0 Comments

 
Rolling over an MTX file is something you do once a year to keep a fixed number of time periods in the model. 

Here is what happens:

  • A copy of the current file is saved in the Archive folder with the rollover year in its name
  • The oldest 12 months of the file are chopped off
  • All other time periods are moved to the left in the MTX file by 12 months
  • The columns are relabelled with the appropriate time period names
  • The “last actual month” is reset to 1
The time to do this is just before loading the first month of the new fiscal year.  If you are on a calendar year, you would perform a rollover some time in February just before loading up January actuals.

Rolling over is easy to do.   You can do one file at a time, or all at once if you have several company files.

To rollover the currently open MTX file:


  1. Select Toolbox / Rollover
  2. Click “Run”
Picture
Picture
BEFORE Rollover:
Picture

Picture
AFTER Rollover:
Picture
Picture
To rollover all MTX files:


  1. Select Toolbox / Rollover
  2. Check the  box “Roll Over all Files in Folder”
  3. Click “Run”

NOTE: Immediately after rollover, the 'last actual month" is set to January of the new year.  The numbers for that month will be the projections for January from just prior to the rollover.  The January actuals should be loaded right away to replace the projected values.


0 Comments

Fort Knox Model - Loading Data and Customizing Names

12/27/2022

0 Comments

 
Loading your own Historical Data

You have two options: 
  1. You can load data from an existing spreadsheet that you maintain and use for financial analysis. 
  2. ​You can export data from your accounting system and map the accounts to input rows in the Fort Knox model.

Actually, there is an option 3: you can type the numbers (or copy/paste)  into the SurvivalWare grid directly.
 
Option 1 - From an Existing Spreadsheet

The important thing is to separate the Profit and Loss statement from the Balance Sheet into two files, and follow a simple convention of labeling rows and columns. 

Row 1 should consist of column labels starting in column B.  These should be in date format corresponding to the month they represent. (e.g. 6/1/2022 or Jun 2022). 

Column A should contain the row names starting in row 2.  They must be identical to the row names used in the Fort Knox model.  The variables are not case sensitive.

In the Fort Knox data folder (C:\SurvivalWareNet\FortKnox\Data) you will find two template files that you can use to enter data for import:
  • DD5-BS-Template.XLSX  (for the balance sheet)
  • DD5-PL-Template.XLSX (for the Profit & Loss statement)
Picture

Fill in the templates with your data.  Modify the column headers in row 1 of the templates so that SurvivalWare knows what each column represents.
Then: Select File / Import Data.. to import each file separately.
Picture
Picture
File to import: 
Select the Excel file (or CSV file) containing the data.

Worksheet:
If you selected an Excel file, select the worksheet within that file


Time Periods:
Normally, you would use “Any Time Period” to import historical months. 

If you want to import a budget, select “Budget” and SurvivalWare will interpret the column headers as Budget Columns.

If you want to import projections only without overwriting any historical columns, select “Projections”

Option 2 - Data exported from your accounting system
 

The spreadsheets need to be saved as CSV files in order for SurvivalWare to import them.  
From QuickBooksThe basic idea is to export a standard Profit and Loss report, and a standard Balance Sheet report.  In Quickbooks, you can select a start and end date.  We suggest loading as much history as possible – all six years if you have it.  Make sure to configure the columns as months so that you get one column per month.
If you use account numbers, these will appear as part of the account names in the report, and this ensures that all account names are unique.  If not, be on the lookout for duplicate names.  You can change these in the csv file manually after export.
Export them directly as CSV files, not as Excel spreadsheets.  Quickbooks does some funny formatting using extra columns for indentation if you export to Excel.
 
Mapping and Loading

​
Once you’ve prepared your CSV files for import, follow this three step process:
1.       Go into the Row Mapper module and select the files for import.
2.       Map the rows
3.       Import the data and check the results
 
From the main screen, select Modules / Row Mapper

​
Picture
For complete documentation on how to map your data, go to this Knowledge Base article:
https://survivalware.issuetrak.com/Kb_ArticleView.asp?ArticleNbr=6

Customizing Account Descriptions

You can rename certain rows with the Flex Names feature
  1. Right click on a row name
  2. Select “Edit Flex Names”
  3. Enter a new value, and that is what appears in the grid and on the graph

Here’s an example of renaming “Dues & Subscriptions” to “Vistage Fees.”

Before:

Picture
Right Click on the row name:

Picture
Type in the new name:
Picture
After:
Picture
0 Comments

The Fort Knox Corporate Planning Model

12/26/2022

0 Comments

 
Picture
The Fort Knox Model is named after the United States Bullion Depository, often known as Fort Knox.  Both are rock solid, and have a lot to do with money.  The depository is a fortified vault building adjacent to the Fort Knox Army Post. It is operated by the United States Department of the Treasury and stores over half the country's gold reserves. 

​

Picture
Summary of what the Fort Knox Model does
The Fort Knox Model is an integrated financial statement forecasting model.  This means that it forecasts a complete Balance Sheet and Cash Flow statement for future time periods, in addition to the Income Statement.

In this article we provide an overview of the model.  Subequent articles will cover the basics for loading history and getting it ready to use.
Picture
The Fort Knox model has a modest number of line items – about 80 for the P&L and 60 for the balance sheet, plus additional margin, cash flow, and KPI line items.

Essentially you load up historical data exported from your accounting system, input assumptions about key drivers of profits and cash flow, and look at the resulting projection of Net Income and Cash for the next 6 to 18 months, or beyond. 
​

There is room in the model for up to 6 years of history, by month.  Besides the current year, there is room for an additional 36 months of forecast, and 10 years after that. You can elect to forecast the 36 months broken down into months, or to switch to annual forecasts after the current year.  The model does a number of calculations on the historical numbers to help you forecast the future and evaluate the reasonableness of your forecast.
Picture
A separate set of columns is set aside to house the current year budget and next year budget.  You probably will want to update the forecast every month.  However, the budget stays static throughout the year, and is used for goal setting and performance monitoring.​
Picture
The Matrix File
 matrix file is similar to a spreadsheet.  It consists of rows and columns of cells, but it is not free-form.  The rows correspond to line items in the financial model – things like “Sales”, “Rent”, “Net Income”.  The columns represent time periods. 

In the Fort Knox model, there are several years worth of months as columns, and then also the quarters, year to date totals, and year totals derived from the months.  The model is smart enough to know the difference between a P&L row, and a Balance Sheet row.  It knows to sum up the 12 months of a year to get “Total Sales” for the year, but that “Total Assets” is an ending balance, and the year value should be the same as the last month of that year.


What the model is used for
  • Cash flow forecasting for SMB
  • Financial reporting
  • Financial analysis
  • Budget preparation
  • Loan proposals
  • Raising capital
  • Cloning

Some examples
  • Environmental consulting firm consolidates two divisions and forecasts profits and cash throughout the year
  • Window distributor keeps an eagle eye on projected cash
  • Equipment parts distributor finds it easier to do financial reporting for its three divisions using the Fort Knox model rather than their accounting software
  • An e-commerce company needed a custom built financial model to navigate some rough waters.  They were able to get it done cheaply by starting with the Fort Knox model.

Major Sections of the Fort Knox Model
ROWS
​

Sales – up to 10 separate categories, plus a row for Intercompany Sales
Picture
Cost of Sales – up to 10 separate categories, matched to the sales rows

Gross Profit and Gross Margin % by category
Picture
Note: Instead of detailed product lines, you have the option of doing a summarized sales forecast where you input Unit Volume and Price per Unit to drive the overall dollar forecast.
Operating Expenses, including 5 “Other Operating Expense” lines that you can rename
Interest and Other Expenses - up to 10 categories of loans, credit lines, and notes payable
Income Taxes and Net Income  - the usual suspects

Assets

Current Assets - the standard one plus 3 “other current asset” categories that can be renamed
Long Term Assets - fixed assets, intercompany receivables, other assets

Liabilities

Current Liabilities - accounts payable, credit card balances, current maturities, credit line tied to A/R balance, other credit line, other payables, deferred revenue
Long Term Liabilities - deferred taxes, long term debt, intercompany payables, other long-term liabilities
Equity
- opening balance, common stock, additional paid in capital, owner distribution / dividends, retained earnings

3 kinds of Cash Flow:
  •  Direct
  •  Indirect
  •  POM (Peace of Mind Schedule from Philip Campbell’s first book, “Never Run out of Cash”)

Working Capital and Days of Working Capital

Break Even Analysis

Valuation


Columns
The Fort Knox model consists of a total of 448 columns.

Months​
  • History (60 months prior to the current year, plus one month for beginning balances)
  • Current Year (12 months)
  • Projected (up to 36 months)
  • Current Year Budget (12 months)
  • Next Year Budget (12 months)

Year to Date

  • History (60 months prior to the current year)
  • Current Year (12 months)
  • Projected (up to 36 months)
  • Current Year Budget (12 months)
  • Next Year Budget (12 months)

Rolling Averages
  • History (60 months prior to the current year)
  • Current Year (12 months)
  • Projected (up to 36 months)

Quarters

  • History (20 quarters prior to the current year)
  • Current Year (4 quarters)
  • Projected (up to 12 quarters)
  • Current Year Budget (4 quarters)
  • Next Year Budget (4 quarters)

Years
  • History (5 years prior to the current year)
  • Current Year (1 year)
  • Projected (up to 3 years)
  • Current Year Budget (1 year)
  • Next Year Budget (1 year)

Up to 10 additional years of projections, input as full year values

Note: the column logic for summing months into quarters, years, year to date values, and rolling averages occurs in the middle of the model.  

P&L items (summed) are treated differently from balance sheet items (end of period balance) when populating the aggregate columns.  Calculations of ratios and percentages are done after the column summing has taken place.  


0 Comments

SurvivalWare 2023 Product Announcement

12/22/2022

0 Comments

 
The developer of the original "RCS - The Micromodeler"(1) from the 1980's has released SurvivalWare 2023, a financial modeling platform for Windows based PC's.  SurvivalWare is available immediately in an "always free" version that includes a prebuilt corporate planning model.

A licensed version for model developers will become available in 2023.

With the free version, you can customize account names, and map data from your accounting system to the line items in the corporate model.

SurvivalWare helps you answer the questions:
  • Where are we headed?
  • Is there anything weird going on?
  • Where's the cash?


With SurvivalWare, you have plenty of history at your fingertips, all in a common format.

You can look at months and years next to each other.

You can drill down for more detail.

You can see what's been going on with the cash.

Visit www.survivalware.com for product details and a free download.
​
Luhring SurvivalWare, Inc. was started 20 years ago by Rusty Luhring to help small business owners compete  (through better cash flow planning).  It is a successor company to Ferox Microsystems. Inc., developer of financial modeling languages and consolidation systems for large corporations.

(1) RCS was one of the first PC based financial modeling languages on the market in the early 1980's  (later published as DSS/Finance in North America and MicroModeller in Europe).  Ferox released ENCORE! Plus, a more powerful modeling language in 1983.
0 Comments
    Picture

    Rusty Luhring

    Founder / CEO of Luhring SurvivalWare, Inc.

    Financial modeling expert

    Categories

    All
    Announcements
    Fort Knox Model
    ROI
    SurvivalWare Tips

    Archives

    January 2023
    December 2022

    RSS Feed

(c) 2023 Luhring SurvivalWare, Inc.             
Home        Products         Blog         About        Contact 
Proudly powered by Weebly